

Posted on October 8th, 2020 in Faculty by Aaron Dusso

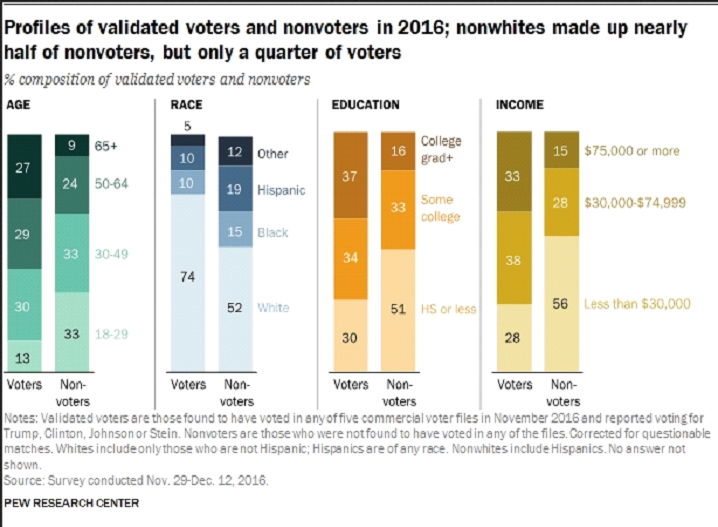
If you haven’t decided if you’re going to go vote this year, below is a pretty chart that breaks down the demographic distribution of those who voted in 2016 and those who stayed home.
Where are you? Are you over or under represented in the voting population?
There is a large swath of our society whose voice is missing in this process. Don’t let yours be one.
You can find your early voting locations here: https://www.in.gov/idr/voteearly.htm
You can find Pew’s entire examinations of the 2016 electorate here:
https://www.pewresearch.org/politics/2018/08/09/an-examination-of-the-2016-electorate-based-on-validated-voters/